Menu in Datalyse:
Emission, e.g. the spectrum of a spectral lamp
Setup parameters... choose the time per scan and enter for each measuring.
Background, i.e. spectrum without light source
Reference, spectrum of a cell with water
Absorbance
The spectrophotometer is equipped with a CCD-array and is capable of measuring wavelengths in the interval 305 nm to 1050 nm. A fibre-optics cable 1.5 meters long transmits the light from the source to the device.
It is possible to measure absorbance, since it is possible to send the light of a built-in halogen lamp into an external cell holder with another fibre-optics cable.
The spectrophotometer can only scan the spectrum. It cannot measure at a specified wavelength. But a scan of 1024 values is measured in no more than 2 seconds (1 second). This way you get the entire spectrum on the screen. This sounds very good.
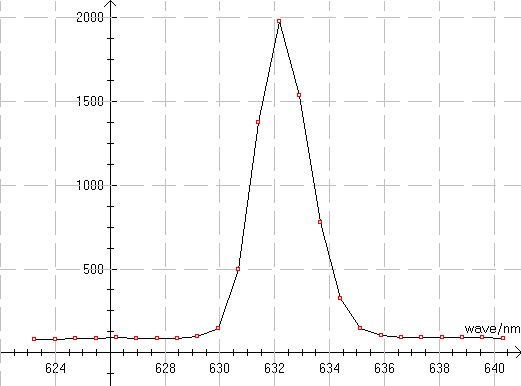
A measuring does take some time however since CCD are not without noise, i.e. they measure light even in darkness:
Emission:
Absorption:
Comments:
CCD's and fibre-optics cables are the future, there are some reservations about the device.

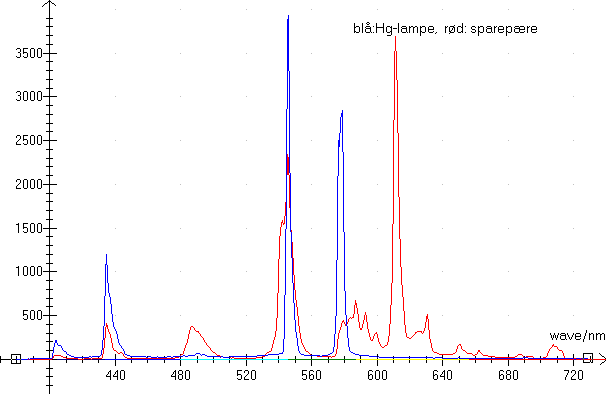
What gas(ses) does an
energy saving bulb contain? Hg seems to be obvious.
Note that Datalyse is capable of displaying multiple graphs simultaneously now. For one thing you can select multiple columns for drawing a graph. For another you can choose between graph and table for 2 devices..
